This post reviews my submission to the IBM Applied Data Science Capstone project on Coursera. It is the culmination of a final submission to a 9-part Data Science certification program. Tools used include: Web scraping, Foursquare API, U.S. Census Data API.
In this theoretical case study, I take on the role of a data scientist reviewing the national day care service industry and with the help of the Foursquare API and some K-means clustering. Leading up the analysis, I in the process of searching for a day care facility for my son and the subsequent conversations with franchise owners led me to review this analysis for their perspective as a business owner, something I spent many years doing as a venture capital investor, analyst and board member. In the following analysis, I look through the lens of the proprietor.
The consumer demand for child care, early education, and back-up care has grown in recent years in concert with the growing number of working family households. Many families continue to migrate within the suburbs of large metro areas and given those cities offer proximity to work there’s an equally significant demand for surrounding facilities with cost effective services for their children.
Business Problem:
A fast growing client is determined to expand to other large metro areas and after internally reviewing the demographics within a segment of the largest cities in the country, have chosen Chicago and Washington, DC for this review stage. Due to the growing populations and high percentage of two-parent household working families, these cities were selected for closer inspection. The data science team is tasked with analyzing the neighborhoods of these large hubs which have shown a successful level of market penetration. It is these neighborhoods that will presume not only a substantial customer base to grow with, but a high likelihood of available labor as well.
Problem Statement:
The data science team will provide data and insight on the more desirable neighborhoods to target by implementing the following data sets and techniques:
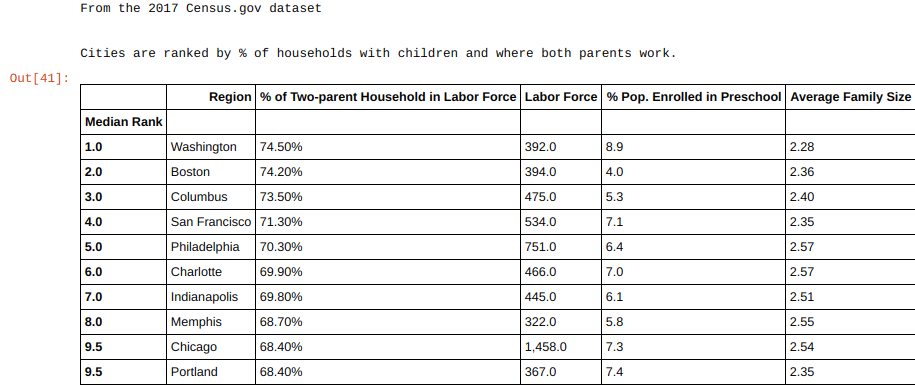
- Part 1: Data summarizing the top 10 U.S. city demographics for labor population and household size.
Data source: The U.S. Census Bureau datasets were included using the Census.gov API. These datasets were used to explore which cities are potentially target rich environments for childcare services and warrant further inspection of its surrounding neighborhoods. The preliminary findings indicated that Chicago and Washington, DC satisfied our clients’ requirements for a growing populous and contain demographics consistent with both parents in the workforce and have children below the age of 6. Further review of the surrounding neighborhoods should yield areas with higher levels of competitor saturation indicating sufficient opportunity for growth and potential labor.
Setting up the Census Data API
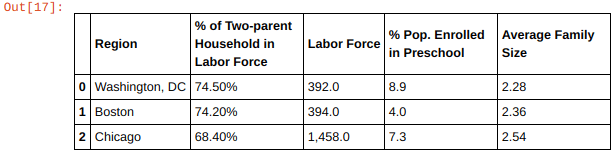
- Part 2: Neighborhood demographics that will indicate favorable environments for deployment.
Data source: Based on enrollment rates in preschool, household in the workforce, and average family size, I narrowed my search to Boston, Chicago and DC for closer review.
From here, web scraping techniques were employed to create datasets from the respective neighborhoods as listed on the associated Wikipedia websites. You can review the detail behind those datasets respectively for Chicago (https://en.wikipedia.org/wiki/List_of_neighborhoods_in_Chicago) and Washington, DC (https://en.wikipedia.org/wiki/Neighborhoods_in_Washington,_D.C.)
Setting up a geolocator function to return coordinates of every neighborhood from all metro areas.
After loading the geopy module, we run our geolocator function to get all neighborhood coordinates. With these coordinates, we can plug them into Foursquare and analyze the business demographics. The example table below was for Chicago. I ran this analysis on the three metro areas we highlighted above.

Finally I combine all three metro areas and their respective neighborhoods into a dataframe, and this will allow us to run the location coordinates through the Foursqaure API.
Return the “Child-care” venues listed in each neighborhood.
The following types of business resulted from our foursquare analysis of ‘child care’ services.

As we identified above, the Foursquare API captured some questionable results from the Daycare search. We need to narrow down the category of venues to the following: Child Care Service, Daycare, Nursery School, and Preschool. The Elementary School and School itself might have some early learning programs but most likely these venues are geared for Kindergarten on up and would not provide meaningful observations.
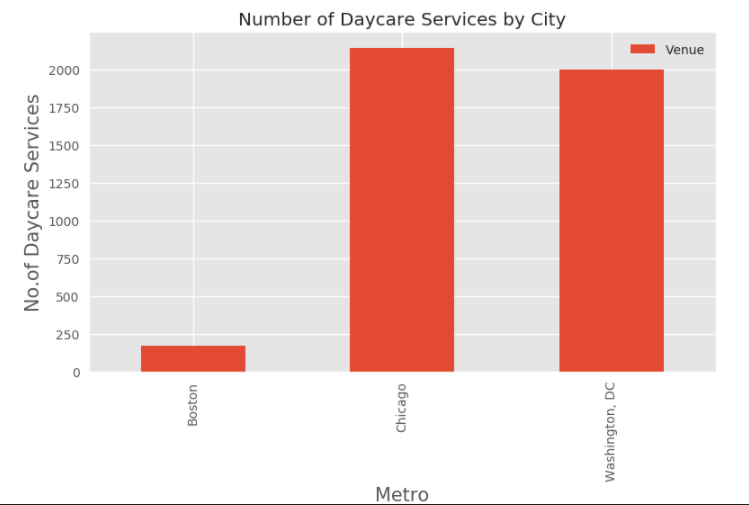
Review our dataset and draw some conclusions
Boston is dwarfed by Chicago and DC in terms of daycare services. While this is partly attributable to a fewer number of neighborhoods, given a comparable labor force population and average family size relative to DC and higher percentage of two parent household in the workforce, the lower facility count in Boston is likely more consistent with a lower preschool population. This could indicate less market saturation and greater opportunity for growth.
Review and cluster the neighborhoods in Boston
Boston reflects the greatest opportunity for growth. In order to differentiate the neighborhoods, we will use a K-Means algorithm. In order to run K-Means, we need to apply the appropriate K value of clusters. Let’s use the Elbow method to find the best number of centroids to properly segment our Boston neighborhoods.

The code above allows to view a dataframe we can map with by assigning a cluster to each neighborhood based on the most common feature venues.

Mapping the neighborhoods by their cluster yields a clear view of daycare facility distribution and saturation around Boston. The preferred Boston neighborhoods for targeting franchise expansion are marked in red. Given a market environment that reflects less saturation and competition for enrollment, these areas could be prime targets for our client to expand its operations.
And with that, we can view our neighborhood map of Boston with some highlighted markers on where to target day care center opportunities.

