Regressing client trading activity to the treasury markets and bond market volatility.
Often times what may make intuitive sense doesn’t tell the whole story. In theory, greater volatility in a market should yield increased activity but in the treasury markets, that may not necessarily hold true. Take the primary dealer activity against the treasury volatility proxy, MOVE Index (Merrill Lynch Option Volatility Estimate ‒ a well-recognized indicator of U.S. interest rate volatility that is often referred to as the VIX for Bonds. As we can see from the scatter plot and heat matrix, the correlations are not terribly strong.

The following project is an example of an analysis that I performed for work on behalf of a request from the CFO of my organization. I was tasked with running a regression analysis on the average trading volumes for US Treasuries and understand the correlations with internal fixed income trading revenues. We also looked at the MOVE Index (Merrill Lynch Option Volatility Estimate) to analyze that correlation as well.
A significant portion of the revenues in this business unit gets generated from the processing of client trading activity. in US treasury securities. Suffice to say, the ability to forecast revenues is integral to management’s guidance to Wall Street, reducing earnings volatility, and ultimately it’s stocks performance.
I will begin by highlighting some of the data consolidation and preprocessing skills utilized in this project as well as some visualization techniques brought to bear.
The following steps were taken and techniques implemented:
- Data Collection From Excel and CSV Files
- Consolidate, Preprocess, Transform and Resample the Datasets
- Visualizing and Exporting the Results with Matplotlib, Seaborn and Openpyxl
Importing the necessary libraries:
After reviewing several possible predictor variables with senior management, we settled on the MOVE Index and the All Treasury Volume(the total volume across all durations). Highlighted below are the one’s we selected for the multi-variate analysis with the FI Trades.
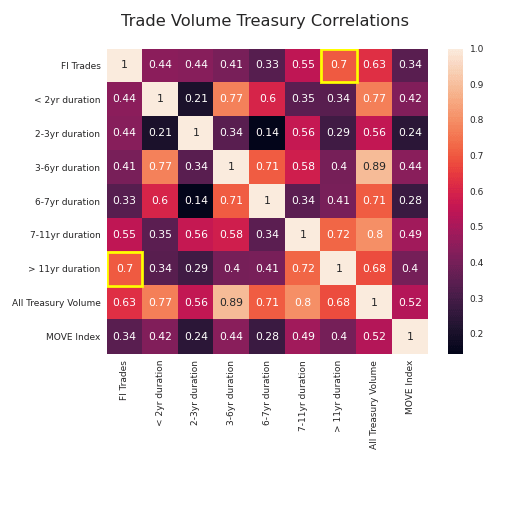
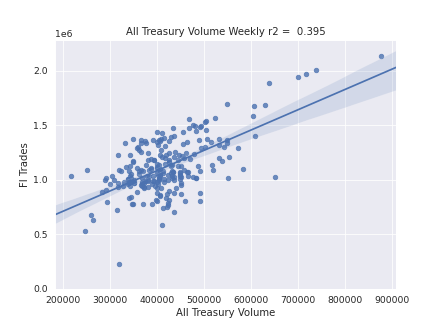
A closer look at the correlations with the treasury volume and the MOVE Index reflect mostly clustered observations with some outliers that help drive the positive correlation.

Viewing a closer inspection of the total volume correlation.
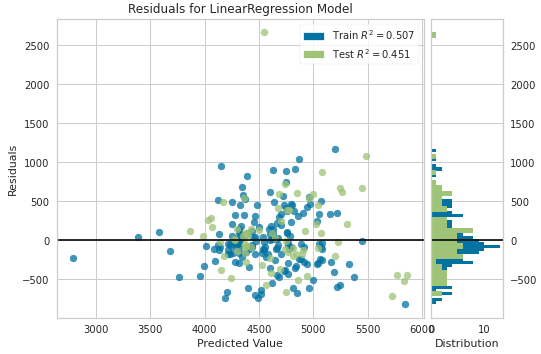
We need to keep digging for other predictor variables to build a stronger model. However given the specific dynamic involved with this client volume activity, the on-boarding of each one and how that impacts customer volume volatility recognition on this platform, it may make sense to study how relationships over time and not over the entire period. Still, we may have been able to rule out some factors that may have made some intuitive sense yet failed to significantly explain the behavior of the internal trading volumes.
