Scraping 10-K filings for equity return alpha by applying an NLP framework. Extracting and studying intrinsic risk associated with the volatility in corporate risk disclosures can yield above average risk adjusted returns given the valuable and actionable time lag.
“…document changes do impact stock prices in a large and significant way, but this happens with a lag: investors only gradually realize the implications of the news hinted at by document changes, but this news eventually does get impounded into future stock prices and future firm operations.”
(Lauren Cohen, Christopher Malloy, and Quoc Nguyen NBER Working Paper No. 25084
September 2018, Revised March 2019, p1)
As an event driven research analyst one could spend countless hours combing through financial statements, buy-side research reports and third party industry specialist publications attempting to decipher data points within a specified time period. Distilling that information into actionable trading themes and more importantly favorable pricing opportunities for the portfolio, otherwise known as portfolio alpha is often the top priority for a PM or analyst when managing relative risk.
One common approach to creating portfolio alpha while also managing risk is to trade one portfolio company against another correlated company, asset or basket, typically in the same industry that contains correlated fundamentals and exposures. An alternative approach to this pair or dispersion trade is by scraping the financial statements of these companies. In doing so, we can focus in on the clues left for us within the subtle changes made between filings and the respective choice of words. When applying these relative signals from firms’ statements of potential risk as found in their financial statements, we can create a valuable source of event-driven investment candidates.
A terrific working paper published in 2019 titled Lazy Prices by Lauren Cohen and Christopher Malloy of Harvard Business School and NBER as well as NBER Quoc Nguyen University of Illinois at Chicago documented the rich information to be gleaned as well as the stock alpha gains from analyzing corporate financial statements. Click the link to view the full report. https://www.nber.org/papers/w25084.pdf
This paper highlights among other things that investors continue to miss a valuable aspect of investment returns. And in contrast to literature that suggested the impact from 10-K filings on stock prices has become muted, over time, the authors note “it is because investors are missing these subtle but important signals from annual reports at the time of the releases, perhaps due to their increased complexity and length.” The researchers conclude that “document changes do impact stock prices in a large and significant way, but this happens with a lag: investors only gradually realize the implications of the news hinted at by document changes, but this news eventually does get impounded into future stock prices and future firm operations.” It is this concept of a lag that was suggested to exist in this analysis that drove me to investigate this theme within each S&P sector.
What I discovered was that there was not only a lag(time to build a position) but a material return spread between those corporate financial statement “changers” and those firms that left their risk sections relatively unchanged from year to year. This concept makes some sense naturally, more commentary about risk should make a company relatively “riskier”, however on the margin, a company that has made a deliberate and sudden tweak or two to its financial disclosures might be telegraphing risk not yet priced into current prices.
I chose to analyze annual 10K filings with the use of scraping, or programmatically extracting information, parsing the text and applying natural language processing(NLP) to decipher the yearly sentiment changes in a firms’ risk disclosure. The goal here was to ultimately assess the risk inherent in a firm’s overall profile. This has become a common NLP model approach to alternative data collection and alpha generating investing for hedge funds.
In this analysis, I reviewed the S&P 500 companies and sought to uncover unique risk profiles for each company and its respective industry. The end-use is designed to provide alpha application by assessing intrinsic risk, some of which may be underappreciated by the market. In further analysis, I will look to see where this can add value as a factor in pricing options, particularly in comparing implied vols and historic volatility.


A few key aspects about the approach I took:
- I narrowed the analysis on one section of the annual 10-K corporate filings, the risk disclosure section by scraping the SEC database with the help of the edgar API for Python. https://pypi.org/project/edgar/
- Next I parsed and tokenized the documents with the following libaries: regex for regular expressions which helped in zeroing in on the Risk Factors section of the filing, spaCy to tokenize the doc and lemmatize its tokens, and lastly scikit-learn to vectorize the words, calculate the word frequencies and perform cosine similarity distances to understand and compare if a firms’ filings are indeed changing over time.
- I focused the analysis on “negative” and strongly worded sentiment word embedding, applying a master dictionary using Loughran and McDonald Financial Sentiment Dictionary for financial sentiment analysis, implemented with a bag of words approach. To view the master dictionary from Loughran and McDonald, click here
- This approach and the combination of applying the cosine similarity algorithm to the Corpus was the method I chose to calculate the overall difference between a consecutive segment of documents. Cosine similarity provided a metric used to measure how similar the documents are irrespective of their size, in this use case it was applied to a year over year comparison.
- One shortcoming in applying this metric to my analysis was the loss of a directional impact. Was the difference between the documents the result of an increase in negative sentiment words or a significant decrease(favorable sentiment change) in these terms? The mere fact that the documents differ wasn’t sufficient. The implication is that a greater increase in negative word embedding should imply a higher intrinsic risk profile, which could improve our understanding of what ultimately is driving the variance between documents. With that in mind, I added another calculation that provides the percentage change in yearly word frequencies. This yields additional explanatory power as given we’re concerned with which firms are portending greater risk on the horizon.
- I ran this analysis on over 400 companies that spanned 11 sectors in the S&P500 with the yahoo finance module yfinance.
Lastly, by grouping each stock and its respective trading window in each year I produced the following dataframe to analyze.
The transformed dataset is structured as follows:

In 8 out the 11 industries studied, a positive spread in abnormal percentage returns existed and persisted for multiple months following the filings. Only two sectors showed excessive unfavorable results. Worth noting that for this study, no stop losses were implemented and in a real world scenario these losses may have been mitigated. The purpose here was to work within a hard cut off at a monthly closing interval, in the case below, the 4th month of the dateset in each respective trading year.

And second, the impact of this analysis did not get impounded into the spread of the stock prices until at after least a month had passed since its fining date. This indicates a lag in informative nature of the filing and the time to adequately build and structure the trade.
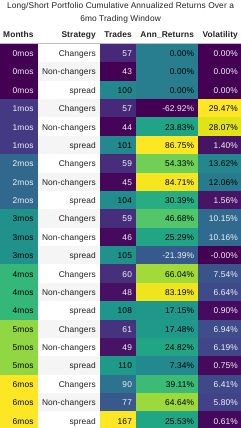
- Over the 5 year period of this analysis, the S&P had gained every year but one. However, the firms that indicated an increase in negative word sentiment embedding(“Changers”) witnessed a notable under-performance relative to the market portfolio(defined as the complete set of S&P500 companies in the dataset) as well as those firms that reduced or maintained a consistent document sentiment(“Non-changers”). Alternatively, the “Non-changers” outperformed all portfolios in nearly every trading window as seen below.
- Across all industries, the spread between these portfolio investments was a cumulative 13% return over the 5-year analysis period. By going long the non-changing firms and shorting the increased negative sentiment changers, this makes for a significant diversification strategy that allows us to hedge against the systematic risk of the industry or broader market.

It is with this in mind, the focus of this analysis was to not just determine relative future stocks prices, although that is certainly a potential use case in certain market environments but more broadly to properly assess risk profiles of stocks and capture alpha within a short-term to intermediate time horizon.

While this post will not dive into effectively structuring trades to capture these abnormal returns, given the identification of those names deemed riskier due to it’s implied risk profile, there are several ways to capture the this potential alpha. In addition to shorting or pricing put options on the underlying stock of the increased “negative sentiment” changing firm, we could create the following portfolio strategies listed below.
- Dispersion portfolios
- Long/Short event driven
- Long/Short ATM straddle portfolios
- Credit Default Swaps (CDS)
